
From Elephant Analytics. http://seekingalpha.com/author/elephant-analytics
The Apple (AAPL) App Store has been extraordinarily successful with third-party apps, having reached the 50 billion download mark earlier in May. However, Apple CFO Peter Oppenheimer mentioned in 2010 that the App Store operated a bit over break-even. As well, Piper Jaffray’s Gene Munster estimated in July 2011 that Apple only made $292 million in profitfrom 15 billion downloads. The prevailing wisdom since then was that the App Store only plays a minimal direct role in Apple’s profitability and serves mainly as an incentive to purchase Apple hardware due to the strong ecosystem. We are going to show that this situation has changed and that the App Store is playing an increasingly significant role in Apple’s profitability (although still fairly small percentage wise). Note that we are only focusing on third-party apps in this article, and not addressing Apple’s own software sales or other items.
Revenue Per Download
Apple mentioned that they reached 45 billion app downloads on its most recent earnings call, with $9 billion paid to developers at that time. Thus an average of $0.20 is paid to developers per app download (combined free and paid). It appears that this $0.20 per download rate is fairly constant based on checks at other times over the past few years.
Since developers get 70% of total app revenues, we can extrapolate that the average revenue per app download is $0.2857 (based on $0.20 divided by 70%). Apple gets to keep 30% of total app revenues, which works out to an average of $0.0857 per app download. From this share they need to pay for storage and delivery costs as well as credit card processing fees.
We are analyzing the numbers for all app downloads since the distinction between paid and free apps is now blurred with the increasing importance of in-app purchases. Distimo now estimates that 71% of iPhone revenue comes from in-app purchases from within free apps, with another 5% from in-app purchases within paid apps.
Storage and Delivery Costs
The size of the average iOS app was 23 MB in October 2012. App sizes are quickly getting larger, so the current average size may be around 26 MB. The average number of updates released was 3.89 per app according to another survey.
The total amount of storage required for 850,000 apps is 25,500 GB if we assume 26 MB per app plus another 4 MB per app in associated screenshots. Amazon S3 storage pricing is $0.055 per GB per month for the lowest tier. Apple should be able to achieve lower costs than what Amazon charges to customers, but if we use the Amazon pricing, the cost of storing 850,000 apps works out to only $16,830 per year, which is a negligible cost per download when you are looking at 20 billion downloads per year.
If we assume that each user downloads all the updates for an app, their total lifetime download per app would be 26 MB for the original download plus 104 MB for four updates per app. This equals 130 MB. The lowest published prices for Amazon S3 data transfer out is $0.05 per GB. As per before, Apple should be able to achieve lower costs. However, at this price it works out to $0.0065 per downloaded app for delivery costs. Combined storage and delivery costs are therefore around $0.0066 per downloaded app.
Credit Card Costs
Credit card processing costs represent a major cost to Apple. Due to a high fixed cost per transaction, microtransactions can be particularly costly. At 15 cents per transaction + 2%, a $0.99 app sale could cost $0.17 in credit card fees, which is 17.2% of the total app cost. Since Apple takes a 30% cut of app sales, this fee may represent over half of Apple’s share.
However, trends in app store revenue sources have served to greatly reduce credit card processing costs for Apple. In-app purchases represented 36% of iPhone app revenue back in June 2010, which is a few months after Oppenheimer first made his break-even comments. This has increased to 76% now and is significant due to recent information that shows that in-app purchase revenue is actually driven mainly bylarge transactions ($9.99 and up) instead of microtransactions as previously though, which makes the relative credit card processing fees lower as a percentage of revenue.
Here’s a look at estimated in-app purchase amounts by transaction size. $9.99 transactions account for 23% of total revenue and have a credit card fee that is 3.5% of the $9.99 transaction value. Thus it contributes 0.81% to the overall total (23% times 3.5%). The result is that in-app purchases have a credit card processing fee that is estimated at 4.31% on average.
| Transaction Amount | % of Total Revenue Generated By Transaction Amount | Credit Card Fee
Per Transaction |
Credit Card Fee (% of Transaction) | Weighted Credit Card Fee (As % of Total Revenue) |
| $0.99 | 1% | $0.17 | 17.2% | 0.17% |
| $1.99 | 6% | $0.19 | 9.5% | 0.57% |
| $2.99 | 15% | $0.21 | 7.0% | 1.05% |
| $4.99 | 8% | $0.25 | 5.0% | 0.40% |
| $6.99 | 2% | $0.29 | 4.1% | 0.08% |
| $9.99 | 23% | $0.35 | 3.5% | 0.81% |
| $14.99 | 11% | $0.45 | 3.0% | 0.33% |
| $19.99 | 24% | $0.55 | 2.8% | 0.67% |
| $24.99 | 2% | $0.65 | 2.6% | 0.05% |
| $49.99 | 8% | $1.15 | 2.3% | 0.18% |
| Average | 100% | 4.31% |
In-app purchases account for 76% of revenue. That leaves 24% for the upfront revenues from paid apps. To be conservative, we’ve split the 24% among $0.99 transactions and $1.99 transactions equally. In reality there are a lot of higher cost apps. The result is that credit card processing fees should be no more than 6.48% of total revenues.
| % of Revenue | Credit Card Processing Fee | Credit Card Fee Weighted as % of Revenue | |
| Paid Apps @ $0.99 | 12% | 17.2% | 2.06% |
| Paid Apps @ $1.99 | 12% | 9.5% | 1.14% |
| In App Purchases | 76% | 4.31% | 3.28% |
| Total | 100% | 6.48% |
There are also a couple of ways that Apple can reduce credit card processing fees. One way is through combining transactions into one charge. Instead of billing five $0.99 purchases separately, if the purchases are done around the same time, Apple can make one charge for $4.95. This would serve to reduce the credit card processing fee from $0.85 to $0.25. As well, purchases made via gift cards would not have the microtransaction issue to deal with.
We are therefore going to estimate that Apple pays an average of 6% of gross receipts in credit card processing costs, making the cost per download $0.0171 (based on 6% times $0.2857 per app download).
Apple’s Gross Margin
If we compile all this information together, we get the following table. Apple’s gross margin is around 6.2 cents per download.
| Per Download | |
| Total Revenue | $0.2857 |
| Developer Share | $0.20 |
| Storage and Delivery Costs | $0.0066 |
| Credit Card Costs | $0.0171 |
| Apple’s Gross Margin | $0.062 |
Here is a separate pie chart to illustrate where all the revenue goes.
(click to enlarge)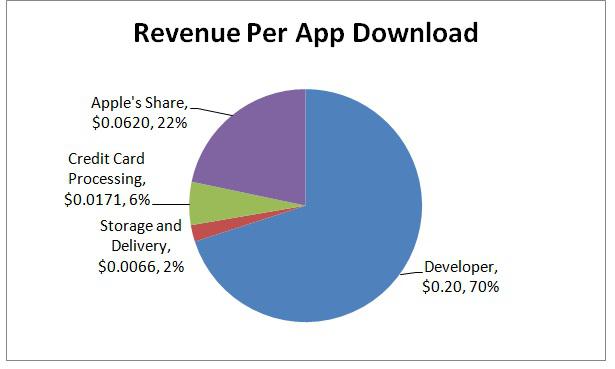
Download rates for the App Store have been around 2 billion per month recently. The below table shows what gross margins look like under various volume scenarios. At around 2 billion downloads per month (25 billion per year), Apple makes $1.55 billion in gross margin per year. Of course there are additional costs involved with maintaining the servers and building out additional App Store features, as well as customer service costs. However, it seems fair to say that Apple makes over $1 billion per year from third-party apps in the App Store even if all that is factored in.
| Number of Downloads (Billion) | 20 | 25 | 30 |
| Gross Margin Per Download | $0.062 | $0.062 | $0.062 |
| Gross Margin ($ Billion) | 1.24 | 1.55 | 1.86 |
Conclusion
The App Store has developed into a major profit source for Apple. While it once operated a little above break-even, the massive growth of downloads plus some significant cost reductions now means that the App Store now makes over $1 billion per year for Apple, and represents about 2-3% of its overall gross margin. It has passed the iPod in terms of overall margin contribution, and could contribute near $3 billion in gross margins per year by 2017 if they do close to 40 billion downloads per year with some reduced costs. That would make sales third-party apps worth around 50% of the entire Mac line in terms of gross margins.
