A somewhat academic but thorough analysis of what happens to Apple stock if it buys its own share using debt.
********************************************
Disclosure: I am long AAPL. I wrote this article myself, and it expresses my own opinions. I am not receiving compensation for it (other than from Seeking Alpha). I have no business relationship with any company whose stock is mentioned in this article. (More…)
This article serves to analyze Apple’s (AAPL) stock buyback program and shed light on the controversial topic.
Due to a series of disappointments, Apple’s stock plummeted from $705 down to $385, which prompted the most aggressive capital returns program by any company in history. Now, here’s where it gets interesting, and a bit confusing simultaneously. Rather than using its tremendous cash, accounts receivable (which will eventually be converted into cash), short-term, and long-term investments pile of $155.46 billion, Apple has chosen to issue debt to buy back its stock. It chose to do so because, in short, the cost of debt is cheaper than its cost of equity. For other reasons, much of Apple’s assets are overseas and the cost of repatriating those assets is too steep. In this article, I will discuss and analyze the stock buyback program Apple has implemented.
Abstract
Apple’s share buyback program through the use of debt has been controversial, but I believe it’s worthwhile for the company to engage in. Ultimately, the buyback program destroys $12.19 billion in value from interest, while adding back $26.5 billion in value from retained dividends. The buybacks will push the share price to $647.78 even assuming unchanging growth prospects.
Approach 1: Cost of Debt vs. Cost of Equity
Cost of Debt
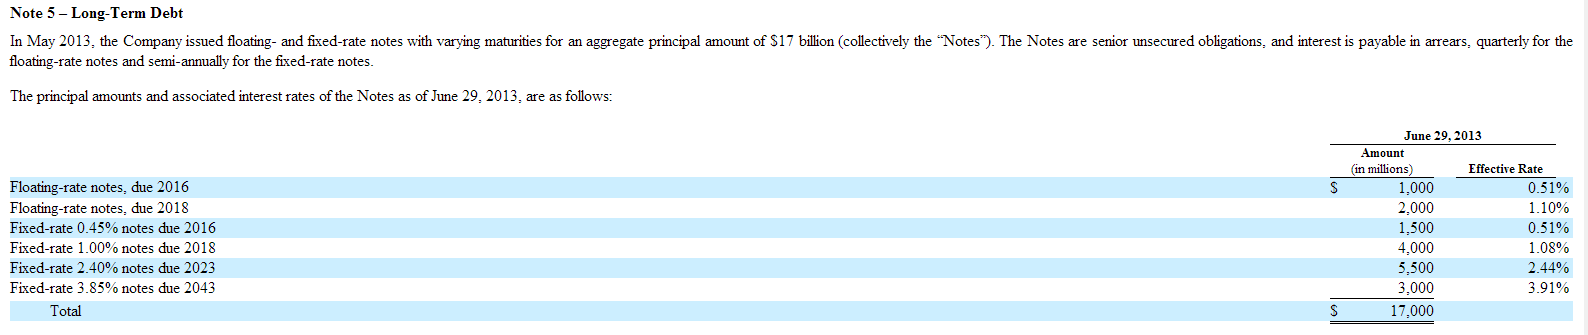
In May, 2013, Apple issued $17 billion in debt to finance its stock buyback program.
(click to enlarge)
The maturities of the notes range from 3-30 years, which allowed Apple to borrow at effective rates ranging from 0.51%-3.91%. Using the 35% marginal tax rate for U.S. corporations, the after-tax cost of debt actually ranges from 0.3315%-2.542%. Ultimately, Apple’s weighted after-tax interest rate is only 1.26%. This seems low, but it’s given the fact that 50% of Apple’s debt issuance matures within 5 years, allowing Apple to benefit tremendously from the low short-term rates.
Cost of Equity
In calculating Apple’s cost of equity, I will be utilizing the Capital Asset Pricing Model, which was introduced by William Sharpe, John Lintner, and Jan Mossin. The creators were awarded the Nobel Memorial Prize in Economics for this tremendous contribution to the financial world.
The model base its theory on a well diversified portfolio and stipulates that any particular stock’s cost of equity is dependent on its level of exposure to market movements. To anyone who follows the stock market, it’s quickly apparent that stocks tend to move together, or correlate each other. This asset pricing model extrapolates that a stock’s level of risk depends how heavily it correlates the market. Essentially, if a stock moves twice the magnitude of the market (in an upwards, or downwards direction), then the investor should be compensated for that increased volatility.
Overall, though, investment risk isn’t solely dependent on market risk (otherwise known as systematic risk). There’s also tremendous business (idiosyncratic) risk associated to investing in a company. Apple, for example, is exposed to competition from Samsung (SSNLF.PK), Google (GOOG), Microsoft (MSFT), BlackBerry (BBRY), and Nokia (NOK), which have been eating into its profits; however, in a well diversified portfolio, an investor would also own Google, for example, which has done well during the past years. Overall, the ups and downs of a particular stock would be nullified by ups and downs in other stocks. Theoretically, idiosyncratic risk would be eliminated in a well diversified portfolio, leaving only systematic risk, or market risk, to worry about. That’s where the Capital Asset Pricing Model comes into play. The formula is as follows:

- E(R) is the expected return, or the cost of equity.
- Rf is the risk free rate
- β represents Beta
- E(Rm) represents the expected return of the market
The cost of equity essentially represents the risk an investor takes on when investing in an asset, which has to be at a premium to a risk-free investment, like investing in U.S. treasuries. It’s arguable that U.S. treasuries aren’t risk-free anymore, like they’ve historically been, but for the sake of this model, we will assume they are still the most risk-free benchmark.
Now, to simply explain what Beta is. In essence, Beta calculates a stock’s magnitude of correlation with the stock market. So, if a stock’s Beta is 1.0 and the stock market moves up/down 10%, then the stock’s expected upward/downward movement is also 10%. If a stock’s Beta is 2.0 and the stock market moves up/down 10%, then the stock’s expected upward/downward movement will be 20%. Beta helps quantify the level of volatility a stock has with respect to the stock market, which helps quantify the expected return for a stock dependent on its market risk.
Quantifying the Cost of Equity
Assumptions will have to be made when building the model. We’ll look at historical and current data to do so. For the sake of conservatism, we’ll assume a 30-year holding period.
Taking the 30-year holding period into account, I needed to define our market risk premium, which is a function of the expected market return and current 30-year risk free rate. To emphasize why I chose the 30-year risk free rate, it’s because I wanted to match our holding period with my duration. Furthermore, I’ll be utilizing the 30-year arithmetic return of the Russell 3000, which has historically been 11.40%. Also, the Russell 3000 resembles the market the closest, assuming its 3000 stock portfolio more definitively correlates the market than the other indices. The current yield on a 30-year treasury sits at 3.86% as of August 20, 2013.
Using the current 30-year risk free rate of 3.86%, as represented by the 30-year U.S. Treasury yield, Beta of 0.98, and expected market return of 11.40%, as represented by the Russell 3000’s 30-year arithmetic average, we can derive a cost of equity of 11.25%.
So, how does this cost of equity really play into the whole Apple valuation thing? Well, the 11.25% is the rate used to discount Apple’s future cash flows, which is used to calculate Apple’s present value. So, for example, let us assume that Apple will generate $50 billion in free cash flow in the next year. The present value of that free cash flow will be ($50 billion)/(1.1125), which comes to $44.94 billion. If Apple generates (for example) $75 billion in 10 years, then the present value becomes ($75 billion)/((1.1125)^10) which comes to $25.83 billion.
The key takeaway here is that the cost of equity is used to discount Apple’s future cash flows to present values, which tremendously influences the stock’s fair value. Essentially, in the long run, an investor who owns shares of Apple is expected to generate 11.25% returns annually.
Recap
So now we know that Apple’s after-tax weighted cost of debt sits at only 1.26%, whereas its stock’s cost of equity sits at 11.25%. The fact that Apple has access to such cheap debt allows it to finance buying back its stock at deep discounts to its stock’s cost of equity. This made it viable for Apple to initiate such a tremendous stock buyback program to create stock price appreciation for its shareholders.
Approach 2: Marginal Cost vs. Marginal Return
The economic concepts of marginal costs and marginal returns support Apple’s buyback program as a way to retain shareholder value. Now, to explain these concepts:
Taken from Investopedia, the Marginal Cost of Production is: “The change in total cost that comes from making or producing one additional item”. The Marginal Return is the change in total return of producing one additional item. So, let’s explain this further.
Scenario 1
If a company wants to create 1 widget, it costs them $3 to make that 1 widget. It can then resell that 1 widget for $10, making a $7 profit on that widget.
If the company wants to create 1,000,000 widgets, it costs them $1 to make each widget because factors like economies of scale come into play. It can then sell those widgets for $10 each, making a $9 profit per widget.
In this scenario, the company is experiencing increased marginal returns from building and selling more widgets, as the profit increases from $7 per widget to $9 per widget.
Scenario 2
If a company wants to create 1 widget, it costs them $3 to make that 1 widget. It can then resell that 1 widget for $10, making a $7 profit on that widget.
If the company wants to create 1,000,000 widgets, it costs them $3 to make each widget. It can then sell those widgets for $10 each, making a $7 profit per widget.
The marginal return on creating the additional widgets is fixed at a constant $7 return per widget.
Scenario 3 (the most important one)
If a company wants to create 1 widget, it costs them $3 to make that 1 widget. It can then resell that 1 widget for $10, making a $7 profit on that widget.
If the company wants to create 1,000,000 widgets, it costs them $5 to make each widget. It can then sell those widgets for $10 each, making a $5 profit per widget.
Here’s where it gets interesting, and very important. In the third scenario, the company is experiencing declines of marginal returns, which means that for each additional widget they create, they’re making less profit per widget.
In this scenario, the company made its maximum profit per widget when creating only 1 widget, but as they ramped up production, the profit per widget declined. Now, let’s create a table to help illustrate this situation, which plays into Apple’s buyback program (I promise).
| Widget Production |
Cost Per Widget |
Revenue Per Widget |
Profit Per Widget |
| 0-500,000 |
$3 |
$10 |
$7 |
| 500,001-1,000,000 |
$5 |
$10 |
$5 |
| $1,000,001-9,999,999 |
$9 |
$10 |
$1 |
| $10,000,000-$15,000,000 |
$9.75 |
$10 |
$0.25 |
| $15,000,001+ |
$12 |
$10 |
($2) |
This table helps illustrate the law of diminishing returns. As production ramps up, the profit of producing each additional widget declines. Ultimately, once the company produces its 15 millionth widget, it will stop producing widgets because producing each additional widget comes at a loss.
Now, how does this all play in with Apple’s stock buyback program? Apple is issuing debt to buy back and retire its stock which pays a nice dividend of $12.20/year, or at a 2.4% yield. Back in May, Apple issued $17 billion in debt at a weighted average after-tax rate of 1.26% and bought its stock which was then yielding 2.4% (back when its dividend was $10.6/year). Applying the current dividend to the historical price for consistency, the stock was yielding 2.8%. So, essentially, Apple issued debt at 1.26% to buy back its stock that was yielding 2.8%, netting them a 1.54% spread which is now retained by the company.
Lately, Carl Icahn has been pushing Apple to issue debt at 3% to buy back and retire shares. Applying Apple’s U.S. marginal tax rate of 35%, the effective cost of that debt will only be 1.95%, as Apple’s stock is still yielding 2.4% in the market. At this point, though, Apple’s net interest spread will be 0.45%, which still makes it worthwhile to buy back and retire its shares. Apple can keep buying back its shares until the net interest spread is 0%, which makes it profitable to continue the buyback until the stock’s dividend yield reaches 1.95%, or when the stock price is $625. As Carl Icahn stated, “Buy the company here and even without earnings growth, we think it ought to be worth $625.” Interesting, I know.
Food For Thought
Apple’s current $60 billion share buyback program still has room to expand, as some analysts claim, and as investors like Carl Icahn are pushing for. Amit Daryanani (from RBC) believes Apple can issue another $55 billion in debt to finance the share buyback program. In total, that would indicate a $115 billion share buyback program. As of now, Apple bought back and retired $17 billion worth of shares through its debt issuance, implying that it can buy back an additional $98 billion in shares assuming such a program expansion would be initiated.
Assuming an average cost of $563.04 (the midpoint of the current stock price and the target $625 price), Apple would be able to retire an additional 174.06 million shares. As per Apple’s most recent earnings report, there are currently 908.42 million shares outstanding. The additional buybacks would reduce the total shares outstanding to 734.36 million shares. Assuming a constant market cap, this would push the share prices to $628.37.
Now, remember where we calculated the marginal cost and marginal returns of share acquisition and concluded that it would be beneficial to repurchase shares up to $625? Well, we just calculated that it would take about $115 billion in debt to do so. Interesting, I know.
The analyst at RBC didn’t use my approach in calculating the additional $55 billion buyback, instead, he looked at average Debt/EBITDA levels for large-cap companies, which is where he calculated that Apple could increase its debt by $55 billion.
However, the market cap won’t stay the same. The interest expense will lead to a degree of value destruction. In my calculations (which I will get into next), the interest expense on $115 billion in debt will destroy a total of $12.19 billion in present value for the company, which would bring its current market cap to $449.26 billion. Even accounting for this adjustment, the share prices will reach $611.77 even with no additional earnings growth. From what it seems, analysts haven’t been accounting for the impact of the interest payments on Apple’s share price.
Methodology
In calculating the value destroyed by Apple issuing new debt, I had to make certain assumptions.
First, I looked at Apple’s previous $17 billion debt issuance to see the spreads Apple was paying on top of U.S. Treasury Rates. From this information, I was able to calculate the new costs of debt Apple would incur if they issued the remaining $98 billion in debt.
Next, I analyzed the structure by which Apple issued its debt. What I found came as follows:
| Bracket |
Maturity |
Debt |
Weight |
| 1 |
3 Years |
1,000,000,000.00 |
5.88% |
| 2 |
5 Years |
2,000,000,000.00 |
11.76% |
| 3 |
3 Years |
1,500,000,000.00 |
8.82% |
| 4 |
5 Years |
4,000,000,000.00 |
23.53% |
| 5 |
10 Years |
5,500,000,000.00 |
32.35% |
| 6 |
30 Years |
3,000,000,000.00 |
17.65% |
| Sum |
|
17,000,000,000.00 |
100.00% |
In short, Apple structured its maturities as follows:
- Expiring in 3 years: 14.71% of total debt issued
- Expiring in 5 years: 35.29% of total debt issued
- Expiring in 10 years: 32.35% of total debt issued
- Expiring in 30 years: 17.65% of total debt issued
From this, I was able to extrapolate the amount of debt Apple would issue according to its maturity:
| Expiration |
Debt |
| 3 Year |
14,411,764,705.88 |
| 5 Year |
34,588,235,294.12 |
| 10 Year |
31,705,882,352.94 |
| 30 Year |
17,294,117,647.06 |
| Sum |
98,000,000,000.00 |
Now I had to calculate the interest rate Apple would be paying on its debt issuance which came as follows:
| Treasury Maturity |
Premium |
Current Treasury Rates |
Apple’s Rate |
After-Tax Rate |
| 3 Year |
0.20% |
0.73% |
0.93% |
0.60% |
| 5 Year |
0.40% |
1.60% |
2.00% |
1.30% |
| 10 Year |
0.75% |
2.84% |
3.59% |
2.33% |
| 30 Year |
1% |
3.86% |
4.86% |
3.16% |
Finally, I had everything I needed: the structure of debt expirations and the after-tax interest rate Apple would be paying on the borrowed funds. With this information, I projected the interest payments Apple would be paying for the next 30 years on the additional $98 billion debt issued. I discounted these outflows with Apple’s cost of equity and found the present value of them to be $10.855 billion. I also applied the same methodology and calculated the present value of Apple’s previous $17 billion debt issuance, and came to $1.334 billion. The total value destroyed from Apple issuing $115 billion in debt came to $12.19 billion.
Value Retention
From our calculations, if Apple were to expand its stock buyback to $115 billion, it would be able to buy back and retire 174.06 million shares. These used to be shares which Apple would have been paying dividends to for the life of the company’s existence, but now it has retained those dividends, which should create some value for the remaining shareholders.
As of now, Apple is paying $12.20 dividends/year per share outstanding; however, the dividend will not remain the same in the future years. In reality, dividends grow through time. So now that Apple has retired those 174.06 million shares, it can now retain all those dividends as well, which would have grown throughout time. So let’s try valuing the amount of savings derived from retaining the dividends on those shares. A few assumptions will be made:
- We’ll assume that Apple will not decrease its future dividends
- We’ll assume that the dividends will grow at 3% per year
- We’ll use the Dividend Discount Model to value the savings to Apple
- We’ll use Apple’s cost of equity of 11.25%
So, what is the Dividend Discount Model? Essentially, it’s a model used to discount future cash flows (dividends) and derive its present value. Utilizing a base dividend/year of $12.20, cost of equity of 11.25%, and growth rate of 3%, we derive a value of $26.51 billion which is retained by the company. Assuming 734.36 million shares outstanding (after the buyback), this translates to an added value of $36.10 per share.
Ultimately, $12.19 billion in value was destroyed by the interest from the buyback program, while $26.5 billion in value was retained. This ultimately pushes the share price up to $647.78 after the buyback program, even if growth prospects have not changed.
Final Words
Apple’s share buyback program through the use of debt has been controversial, but I believe it’s worthwhile for the company to engage in. Ultimately, the buyback program destroys $12.19 billion in value from interest, while adding back $26.5 billion in value from retained dividends. The buybacks will push the share price to $647.78 even assuming unchanging growth prospects.
Apple is currently in a position in which its access to debt markets creates a strategic opportunity to finance stock buybacks, which will lead to share price appreciation, even without any additional growth prospects. Many have argued, to which I agree, that Apple’s stock is undervalued and this buyback program will allow Apple’s management to take advantage of this opportunity. Some argue that this is a form of “financial engineering” and artificially inflating the stock price, which just isn’t true. In the end, the shares that are being bought back are being retired, which increases the value of each remaining share outstanding, leading to gains for current shareholders.
Disclosure: I am long AAPL. I wrote this article myself, and it expresses my own opinions. I am not receiving compensation for it (other than from Seeking Alpha). I have no business relationship with any company whose stock is mentioned in this article. (More…)
This article serves to analyze Apple’s (AAPL) stock buyback program and shed light on the controversial topic.
Due to a series of disappointments, Apple’s stock plummeted from $705 down to $385, which prompted the most aggressive capital returns program by any company in history. Now, here’s where it gets interesting, and a bit confusing simultaneously. Rather than using its tremendous cash, accounts receivable (which will eventually be converted into cash), short-term, and long-term investments pile of $155.46 billion, Apple has chosen to issue debt to buy back its stock. It chose to do so because, in short, the cost of debt is cheaper than its cost of equity. For other reasons, much of Apple’s assets are overseas and the cost of repatriating those assets is too steep. In this article, I will discuss and analyze the stock buyback program Apple has implemented.
Abstract
Apple’s share buyback program through the use of debt has been controversial, but I believe it’s worthwhile for the company to engage in. Ultimately, the buyback program destroys $12.19 billion in value from interest, while adding back $26.5 billion in value from retained dividends. The buybacks will push the share price to $647.78 even assuming unchanging growth prospects.
Approach 1: Cost of Debt vs. Cost of Equity
Cost of Debt
In May, 2013, Apple issued $17 billion in debt to finance its stock buyback program.
(click to enlarge)
The maturities of the notes range from 3-30 years, which allowed Apple to borrow at effective rates ranging from 0.51%-3.91%. Using the 35% marginal tax rate for U.S. corporations, the after-tax cost of debt actually ranges from 0.3315%-2.542%. Ultimately, Apple’s weighted after-tax interest rate is only 1.26%. This seems low, but it’s given the fact that 50% of Apple’s debt issuance matures within 5 years, allowing Apple to benefit tremendously from the low short-term rates.
Cost of Equity
In calculating Apple’s cost of equity, I will be utilizing the Capital Asset Pricing Model, which was introduced by William Sharpe, John Lintner, and Jan Mossin. The creators were awarded the Nobel Memorial Prize in Economics for this tremendous contribution to the financial world.
The model base its theory on a well diversified portfolio and stipulates that any particular stock’s cost of equity is dependent on its level of exposure to market movements. To anyone who follows the stock market, it’s quickly apparent that stocks tend to move together, or correlate each other. This asset pricing model extrapolates that a stock’s level of risk depends how heavily it correlates the market. Essentially, if a stock moves twice the magnitude of the market (in an upwards, or downwards direction), then the investor should be compensated for that increased volatility.
Overall, though, investment risk isn’t solely dependent on market risk (otherwise known as systematic risk). There’s also tremendous business (idiosyncratic) risk associated to investing in a company. Apple, for example, is exposed to competition from Samsung (SSNLF.PK), Google (GOOG), Microsoft (MSFT), BlackBerry (BBRY), and Nokia (NOK), which have been eating into its profits; however, in a well diversified portfolio, an investor would also own Google, for example, which has done well during the past years. Overall, the ups and downs of a particular stock would be nullified by ups and downs in other stocks. Theoretically, idiosyncratic risk would be eliminated in a well diversified portfolio, leaving only systematic risk, or market risk, to worry about. That’s where the Capital Asset Pricing Model comes into play. The formula is as follows:
- E(R) is the expected return, or the cost of equity.
- Rf is the risk free rate
- β represents Beta
- E(Rm) represents the expected return of the market
The cost of equity essentially represents the risk an investor takes on when investing in an asset, which has to be at a premium to a risk-free investment, like investing in U.S. treasuries. It’s arguable that U.S. treasuries aren’t risk-free anymore, like they’ve historically been, but for the sake of this model, we will assume they are still the most risk-free benchmark.
Now, to simply explain what Beta is. In essence, Beta calculates a stock’s magnitude of correlation with the stock market. So, if a stock’s Beta is 1.0 and the stock market moves up/down 10%, then the stock’s expected upward/downward movement is also 10%. If a stock’s Beta is 2.0 and the stock market moves up/down 10%, then the stock’s expected upward/downward movement will be 20%. Beta helps quantify the level of volatility a stock has with respect to the stock market, which helps quantify the expected return for a stock dependent on its market risk.
Quantifying the Cost of Equity
Assumptions will have to be made when building the model. We’ll look at historical and current data to do so. For the sake of conservatism, we’ll assume a 30-year holding period.
Taking the 30-year holding period into account, I needed to define our market risk premium, which is a function of the expected market return and current 30-year risk free rate. To emphasize why I chose the 30-year risk free rate, it’s because I wanted to match our holding period with my duration. Furthermore, I’ll be utilizing the 30-year arithmetic return of the Russell 3000, which has historically been 11.40%. Also, the Russell 3000 resembles the market the closest, assuming its 3000 stock portfolio more definitively correlates the market than the other indices. The current yield on a 30-year treasury sits at 3.86% as of August 20, 2013.
Using the current 30-year risk free rate of 3.86%, as represented by the 30-year U.S. Treasury yield, Beta of 0.98, and expected market return of 11.40%, as represented by the Russell 3000’s 30-year arithmetic average, we can derive a cost of equity of 11.25%.
So, how does this cost of equity really play into the whole Apple valuation thing? Well, the 11.25% is the rate used to discount Apple’s future cash flows, which is used to calculate Apple’s present value. So, for example, let us assume that Apple will generate $50 billion in free cash flow in the next year. The present value of that free cash flow will be ($50 billion)/(1.1125), which comes to $44.94 billion. If Apple generates (for example) $75 billion in 10 years, then the present value becomes ($75 billion)/((1.1125)^10) which comes to $25.83 billion.
The key takeaway here is that the cost of equity is used to discount Apple’s future cash flows to present values, which tremendously influences the stock’s fair value. Essentially, in the long run, an investor who owns shares of Apple is expected to generate 11.25% returns annually.
Recap
So now we know that Apple’s after-tax weighted cost of debt sits at only 1.26%, whereas its stock’s cost of equity sits at 11.25%. The fact that Apple has access to such cheap debt allows it to finance buying back its stock at deep discounts to its stock’s cost of equity. This made it viable for Apple to initiate such a tremendous stock buyback program to create stock price appreciation for its shareholders.
Approach 2: Marginal Cost vs. Marginal Return
The economic concepts of marginal costs and marginal returns support Apple’s buyback program as a way to retain shareholder value. Now, to explain these concepts:
Taken from Investopedia, the Marginal Cost of Production is: “The change in total cost that comes from making or producing one additional item”. The Marginal Return is the change in total return of producing one additional item. So, let’s explain this further.
Scenario 1
If a company wants to create 1 widget, it costs them $3 to make that 1 widget. It can then resell that 1 widget for $10, making a $7 profit on that widget.
If the company wants to create 1,000,000 widgets, it costs them $1 to make each widget because factors like economies of scale come into play. It can then sell those widgets for $10 each, making a $9 profit per widget.
In this scenario, the company is experiencing increased marginal returns from building and selling more widgets, as the profit increases from $7 per widget to $9 per widget.
Scenario 2
If a company wants to create 1 widget, it costs them $3 to make that 1 widget. It can then resell that 1 widget for $10, making a $7 profit on that widget.
If the company wants to create 1,000,000 widgets, it costs them $3 to make each widget. It can then sell those widgets for $10 each, making a $7 profit per widget.
The marginal return on creating the additional widgets is fixed at a constant $7 return per widget.
Scenario 3 (the most important one)
If a company wants to create 1 widget, it costs them $3 to make that 1 widget. It can then resell that 1 widget for $10, making a $7 profit on that widget.
If the company wants to create 1,000,000 widgets, it costs them $5 to make each widget. It can then sell those widgets for $10 each, making a $5 profit per widget.
Here’s where it gets interesting, and very important. In the third scenario, the company is experiencing declines of marginal returns, which means that for each additional widget they create, they’re making less profit per widget.
In this scenario, the company made its maximum profit per widget when creating only 1 widget, but as they ramped up production, the profit per widget declined. Now, let’s create a table to help illustrate this situation, which plays into Apple’s buyback program (I promise).
| Widget Production |
Cost Per Widget |
Revenue Per Widget |
Profit Per Widget |
| 0-500,000 |
$3 |
$10 |
$7 |
| 500,001-1,000,000 |
$5 |
$10 |
$5 |
| $1,000,001-9,999,999 |
$9 |
$10 |
$1 |
| $10,000,000-$15,000,000 |
$9.75 |
$10 |
$0.25 |
| $15,000,001+ |
$12 |
$10 |
($2) |
This table helps illustrate the law of diminishing returns. As production ramps up, the profit of producing each additional widget declines. Ultimately, once the company produces its 15 millionth widget, it will stop producing widgets because producing each additional widget comes at a loss.
Now, how does this all play in with Apple’s stock buyback program? Apple is issuing debt to buy back and retire its stock which pays a nice dividend of $12.20/year, or at a 2.4% yield. Back in May, Apple issued $17 billion in debt at a weighted average after-tax rate of 1.26% and bought its stock which was then yielding 2.4% (back when its dividend was $10.6/year). Applying the current dividend to the historical price for consistency, the stock was yielding 2.8%. So, essentially, Apple issued debt at 1.26% to buy back its stock that was yielding 2.8%, netting them a 1.54% spread which is now retained by the company.
Lately, Carl Icahn has been pushing Apple to issue debt at 3% to buy back and retire shares. Applying Apple’s U.S. marginal tax rate of 35%, the effective cost of that debt will only be 1.95%, as Apple’s stock is still yielding 2.4% in the market. At this point, though, Apple’s net interest spread will be 0.45%, which still makes it worthwhile to buy back and retire its shares. Apple can keep buying back its shares until the net interest spread is 0%, which makes it profitable to continue the buyback until the stock’s dividend yield reaches 1.95%, or when the stock price is $625. As Carl Icahn stated, “Buy the company here and even without earnings growth, we think it ought to be worth $625.” Interesting, I know.
Food For Thought
Apple’s current $60 billion share buyback program still has room to expand, as some analysts claim, and as investors like Carl Icahn are pushing for. Amit Daryanani (from RBC) believes Apple can issue another $55 billion in debt to finance the share buyback program. In total, that would indicate a $115 billion share buyback program. As of now, Apple bought back and retired $17 billion worth of shares through its debt issuance, implying that it can buy back an additional $98 billion in shares assuming such a program expansion would be initiated.
Assuming an average cost of $563.04 (the midpoint of the current stock price and the target $625 price), Apple would be able to retire an additional 174.06 million shares. As per Apple’s most recent earnings report, there are currently 908.42 million shares outstanding. The additional buybacks would reduce the total shares outstanding to 734.36 million shares. Assuming a constant market cap, this would push the share prices to $628.37.
Now, remember where we calculated the marginal cost and marginal returns of share acquisition and concluded that it would be beneficial to repurchase shares up to $625? Well, we just calculated that it would take about $115 billion in debt to do so. Interesting, I know.
The analyst at RBC didn’t use my approach in calculating the additional $55 billion buyback, instead, he looked at average Debt/EBITDA levels for large-cap companies, which is where he calculated that Apple could increase its debt by $55 billion.
However, the market cap won’t stay the same. The interest expense will lead to a degree of value destruction. In my calculations (which I will get into next), the interest expense on $115 billion in debt will destroy a total of $12.19 billion in present value for the company, which would bring its current market cap to $449.26 billion. Even accounting for this adjustment, the share prices will reach $611.77 even with no additional earnings growth. From what it seems, analysts haven’t been accounting for the impact of the interest payments on Apple’s share price.
Methodology
In calculating the value destroyed by Apple issuing new debt, I had to make certain assumptions.
First, I looked at Apple’s previous $17 billion debt issuance to see the spreads Apple was paying on top of U.S. Treasury Rates. From this information, I was able to calculate the new costs of debt Apple would incur if they issued the remaining $98 billion in debt.
Next, I analyzed the structure by which Apple issued its debt. What I found came as follows:
| Bracket |
Maturity |
Debt |
Weight |
| 1 |
3 Years |
1,000,000,000.00 |
5.88% |
| 2 |
5 Years |
2,000,000,000.00 |
11.76% |
| 3 |
3 Years |
1,500,000,000.00 |
8.82% |
| 4 |
5 Years |
4,000,000,000.00 |
23.53% |
| 5 |
10 Years |
5,500,000,000.00 |
32.35% |
| 6 |
30 Years |
3,000,000,000.00 |
17.65% |
| Sum |
|
17,000,000,000.00 |
100.00% |
In short, Apple structured its maturities as follows:
- Expiring in 3 years: 14.71% of total debt issued
- Expiring in 5 years: 35.29% of total debt issued
- Expiring in 10 years: 32.35% of total debt issued
- Expiring in 30 years: 17.65% of total debt issued
From this, I was able to extrapolate the amount of debt Apple would issue according to its maturity:
| Expiration |
Debt |
| 3 Year |
14,411,764,705.88 |
| 5 Year |
34,588,235,294.12 |
| 10 Year |
31,705,882,352.94 |
| 30 Year |
17,294,117,647.06 |
| Sum |
98,000,000,000.00 |
Now I had to calculate the interest rate Apple would be paying on its debt issuance which came as follows:
| Treasury Maturity |
Premium |
Current Treasury Rates |
Apple’s Rate |
After-Tax Rate |
| 3 Year |
0.20% |
0.73% |
0.93% |
0.60% |
| 5 Year |
0.40% |
1.60% |
2.00% |
1.30% |
| 10 Year |
0.75% |
2.84% |
3.59% |
2.33% |
| 30 Year |
1% |
3.86% |
4.86% |
3.16% |
Finally, I had everything I needed: the structure of debt expirations and the after-tax interest rate Apple would be paying on the borrowed funds. With this information, I projected the interest payments Apple would be paying for the next 30 years on the additional $98 billion debt issued. I discounted these outflows with Apple’s cost of equity and found the present value of them to be $10.855 billion. I also applied the same methodology and calculated the present value of Apple’s previous $17 billion debt issuance, and came to $1.334 billion. The total value destroyed from Apple issuing $115 billion in debt came to $12.19 billion.
Value Retention
From our calculations, if Apple were to expand its stock buyback to $115 billion, it would be able to buy back and retire 174.06 million shares. These used to be shares which Apple would have been paying dividends to for the life of the company’s existence, but now it has retained those dividends, which should create some value for the remaining shareholders.
As of now, Apple is paying $12.20 dividends/year per share outstanding; however, the dividend will not remain the same in the future years. In reality, dividends grow through time. So now that Apple has retired those 174.06 million shares, it can now retain all those dividends as well, which would have grown throughout time. So let’s try valuing the amount of savings derived from retaining the dividends on those shares. A few assumptions will be made:
- We’ll assume that Apple will not decrease its future dividends
- We’ll assume that the dividends will grow at 3% per year
- We’ll use the Dividend Discount Model to value the savings to Apple
- We’ll use Apple’s cost of equity of 11.25%
So, what is the Dividend Discount Model? Essentially, it’s a model used to discount future cash flows (dividends) and derive its present value. Utilizing a base dividend/year of $12.20, cost of equity of 11.25%, and growth rate of 3%, we derive a value of $26.51 billion which is retained by the company. Assuming 734.36 million shares outstanding (after the buyback), this translates to an added value of $36.10 per share.
Ultimately, $12.19 billion in value was destroyed by the interest from the buyback program, while $26.5 billion in value was retained. This ultimately pushes the share price up to $647.78 after the buyback program, even if growth prospects have not changed.
Final Words
Apple’s share buyback program through the use of debt has been controversial, but I believe it’s worthwhile for the company to engage in. Ultimately, the buyback program destroys $12.19 billion in value from interest, while adding back $26.5 billion in value from retained dividends. The buybacks will push the share price to $647.78 even assuming unchanging growth prospects.
Apple is currently in a position in which its access to debt markets creates a strategic opportunity to finance stock buybacks, which will lead to share price appreciation, even without any additional growth prospects. Many have argued, to which I agree, that Apple’s stock is undervalued and this buyback program will allow Apple’s management to take advantage of this opportunity. Some argue that this is a form of “financial engineering” and artificially inflating the stock price, which just isn’t true. In the end, the shares that are being bought back are being retired, which increases the value of each remaining share outstanding, leading to gains for current shareholders.


{ 36 comments… read them below or add one }
Great article. And no, I’m not trying to bash you – I believe that everyone should try malting his own grain at least once to understand how the process works.
But the commercial maltsers have gotten their process down to such a science that I don’t believe any of us can get close to their consistency. They control their process all the way out to the farmers, expecting them to grow & deliver grain with a protein content not above a particular percent and an exact moisture content range. Barley that does not meet these standards usually becomes cereal or cooking additives or animal feed.
I have a HVLP painting compressor that I use to dry the malt. I attach a garden hose to the compressor and the other end to a plywood disc with holes covered with window screen at the bottom of a 5 gal bucket. The clean compressed air (this is a turbine pump) flows up thru the malt and drys it in no time. You can put an engine block heater in the hose if you want more heat.
Too simple.
Thought others might like this.
http://www.ehow.com/how_5956849_malt-barley.html
Given my knowledge of the cereal grain growing system, the best place to purchase your grain is at a seed plant. Basically a seed selling company that sells to the farmers. The variety of grain is certified, and it is cleaned better than feed grain. They will know exactly which of the many varieties of barley are best suited for malting. They also size the grain so it is uniform and give a percentage of germination and timeline. The price is a little more than feed, but we are still talking about 10 to 12 dollars for fifty pounds.
Jay, Thanks for the info – I appreciate the great tip on getting grains from seed plants!
Brad
Keep the comments comin´, guys! This is all excellent stuff.
I´ve tried my hand at malting before a couple times and have failed …but that´s not going to stop me. Success teaches you nothing.
Down here in Argentina, I have excellent access to beer barley (cebada cervecera) from “seed plants” that service all the giant breweries here. Malt extract here is all imported and the price is prohibitive. Barley malt is much more inexpensive. Malting your own is the key to free beer.
We need to learn how to do this.
When you malt your own barley, you are your own man.
It´s the next logical extention. I aspire to be a maltster.
Please keep helping.
Yanqui Mike http://www.yanquimike.com.ar 011 -54 -9 -11 -3803 -7099 (cel) 312-235-2241 (VoIP) yanquimike (skype)
Thanks! Best wishes to you and thank you for the kind comments.
Brad
If say someone is out of work and they can start brewing as soon as their malt is finished germination could he skip the drying step (except for specialty malt toasting for an hour or so in the oven) and go straight to brewing?
Hi, No – you actually can’t skip the drying step. It is important to reduce the amount of water in the malt before you brew with it.
Brad
I malted my barley and it sprouted a lot faster than i thought and some of it sprouted a little to far. I dried it and then roasted it at 225 for a few hours. The only thing is it is Six row and ends up cloudy do you have any suggestions on keeping it from clouding ???
Check this cool video out regarding the subject at hand. I’m in the process of trying this out right now. Wish me luck!!
http://www.youtube.com/watch?v=HauYECAEQ8I
“Start with a large bucket that can handle the grains plus enough water to float all of the grains.” just a tip only the bad grains will float to the top witch must be removed, the good grains will sink to the bottom.
If you going to buy barley from a seed supplier, make sure it is UNTREATED! Unless you want to be poisoned…
Thanks for the article, I just bought 3000 pounds of Metcalfe barley to feed my milk goats (almost a years supply at the rate I’m feeding) and I thought I might attempt a little homebrew with it. (The low protein makes it better for homebrew than for goat feed.) I’ve never done all grain just partial. The barley looks good and should be appropriate though because the farmer sell to Coors and Miller. I got it for 10 cents a pound which is what it’s going for on the commodity exchanges right now so pretty damn good deal. Can’t beat commercial brewery prices
I took my dads dump truck out with two bean boxes (large steel containers that hold about 1500 pounds of barley each) and he filled them strait out of his combine. I can’t find a single image of a bean box on google which I find quite strange as they’re used quite a bit in southern Idaho. My wife, daughter, and I got to ride with him in the combine for a couple passes which was awesome. Those things are so fancy it makes you feel like you’re in the future.
I am only a few steps away from making my first beer from scratch. I know, the ‘few’ steps may turn into many paths wandered, lost, and revisited, but at least I have already a lot of experience sprouting grains!
How long do the malted hops keep for and is there a recommended storage technique?
Also is the technique the same for barley?
hey Brad, Great article thanks for the info and clear steps. While I agree that commercially this is done to such precision that a home malter wont be able to come close, I am still going to give it a try. I recently started growing my own barley and other grains in very small batches, (even going to try hops) just so that I can drink a glass of beer knowing that I made everything in it. So even if I lose half of my grains to poor malting, It will still be worth it.
Thanks, Jeff
I have malted alot of feed barley.I can never get the same resaults twice.I have some made some of the best beers I have ever tasted then the next time they are not so good.I think the most important part is make sure you get all the rootlets out.Also make sure you don’t have any mold in you malted grain.I figure I can make 5 gallons of beer for under $5.00.My beer is incredible about 80% of the time.Your can get a rich taste with some of these feed type barleys that you can’t get with the malting varieties.
Brad, Thanks for following up on the question about skipping the drying step, and going straight to mashing. I was somewhat confused by your answer though. Why is it important to reduce the water content in the malt when the next thing you are going to do is soak it in water during mashing?
You have to dry the malt for storage. If you left it wet for any length of time it would spoil. Now if you did a mash immediately you could probably cut out the drying time if working with simple pale malt. Obviously any specialty malt must be kilned or roasted to develop flavor.
Seems like you might also have trouble getting the rootlets to fall out if you don’t dry it – wouldn’t you?
Regarding drying the malt before use, the spoilage issues are perhaps the most important reasons, as ecplained by Brad. Thus, the reduced moisture level ensures greater shelf stability. Beyond the storage imperatives, that is, even if you are not going to store the grains for any length of time, you still need to dry and kiln the grains in order to develop the rich malty flavor and aroma. Otherwise the undried malt will have a grassy aroma/flavor. Addittionally, the wet malt may not mill properly, as it may tend to be gummy. On the other hand, the freshly malted, wet, barley grains may contain a higher level of enzymes, as some of those original enzymes are destroyed by the drying and kilning heat. Hope that helps.
Kola.
Have malted numerous batches of barley. This time it appears to have stalled with acrospire at approximately 1/2 the length of the grain. Any ideas what may have caused the modification process to stop? I question the moisture, but did the same procedure as previous batches.
I really don’t know – usually if you give it sufficient moisture it will continue to grow.
Thanks for the great article. I’ve been thinking about putting in a quarter acre or so of barley, and maybe eventually some wheat and oats to increase my overall options. Any thoughts about varieties of 2 row and 6 row I should be looking at?
Great article and forum guys and gals, I have malted lots of Barley in the last 12 months. I steep the grains in stainless steel colanders, inside stainless steel bowls. I take them out and steep them usually 3 times, at that point the little rootlets are starting to protrude from the colander. I grow the seeds until all of them have a leaf inside, (you need to split the seed to see this), and this is usually when the roots are twice the size of the seed. I warm the seeds in an oven tray in the oven for 3 or 4 hours just warming them to 50deg c, turning the oven off and on to ensure this low temp. After this the roots and sprouts are dried out, so I transfer them to an old clothes drier where they shed their roots and sprouts. The result is a malt high in carb and low in protein, which is what you want to make good booze, cheers Brian….
Where do you buy the barley from? Is there a website that you can buy that from?
As the article says unmalted barley is often sold in bulk at feed stores where you buy grains to feed animals. You do need to take some care to get good quality though, as not all of it has been stored properly.
I get my barley from Albert Lea Seed in Albert Lea, minnesota. http://www.alseed.com Good grain and clean. Conlon seed comes from North Dakota and is being used by many brewers. Give it a shot…
Having malted barley , dried and removed the rootlets, how do you get rid of the hulls before mashing ?
If you are talking about the grain hull, you just crush the grains and leave the hulls in the mash. They help filter the wort when sparging.
hello i am a farmer and i love beer and wine .i make lots of wine and i wanted to make beer from scratch .its alot harder than wine .anyway about the barley there is feed and beer barley they look the same on the outside but the proteins are different now you know
BeerSmith Rocks!
Hey, guys …can you give me an opinion on this:
http://youtu.be/uXTfuMXehbs
Here´s my question: how different is this homemade grain dryer from a malting floor …if I were to add a hand-held laser thermometer?
I live completely off the grid on a place that looks just like this video. I have access to TONS of some of the best beer barley in the world, it comes in 100 lb sacks with the name of the destination brewery already printed on it.
I can sprout the grains with no problem (I´ve done it before.)
I´d like to put in a brewing operation for me and my friends …we drink lots of beer …AND I´d like to do it on a large homebrew scale.
This tremendous beer barley right from the grain elevator is almost free. If I can malt my own barley, I can make beer almost free.
The trouble is that I don´t have any electricity and propane is expensive …AND I´d like to malt the barley on a rather large scale so I don´t have to do it terribly often.
I´ve got LOTS of room and lots of wood and all the junk I would need to build a contraption just like in this video.
Since I don´t like to go into town very often (I´m 200 miles from the nearest big city with beer making supplies,) I´d like to malt barley with plenty of enzyme to enhance my fermentables. If I want to toast some of it a bit more for different characters, this rig should allow me to do so …I think!
I realize that kilning is not exactly drying …but how different is it?
The rig in the video looks like a small malting floor …and that is exactly what I need.
Please gimme yer thoughts …and CHEERS! Mike
Here’s a great primitive overview of malting barley from the great 1976 book, The Complete Guide to Self-Sufficiency, by John Seymour. http://www.yanquimike.com.ar/maltingbarley.pdf He suggests kilning over a perforated something or other …over a fire. I would imagine that would impart at least a little smokiness to the malt no matter how light. Whadda you guys think¿
Sorry to bother but …something else just occurred to me regarding making beer from your own malt: “Let´s say, if you were ready to make beer …and, at the same moment, your malt was ready for kilning …could you put the unkilned malt directly into the mash?”
The reason I ask is: I´m very concerned with conserving as much of the enzyme as possible.
It seems to me that kilning the malt is to stop it from sprouting more …and to preserve it by drying.
I imagine that this would be the palest malt on earth! But the most enzymatic. I´m sure that I would kiln a good amount to a darker more caramelized state to add to the fresh green unmalted pale malt …simply to add character. But I wouldn´t have to worry that my mash lacked in enzyme.
Am I worrying TOO much about sufficient enzyme in my malt in my mash? I am really, really off the grid and, as such, I won´t always have access to buying enzyme powder.
Please give me your thoughts on this …whether or not you have ever malted your own barley.
Thanks, Mike